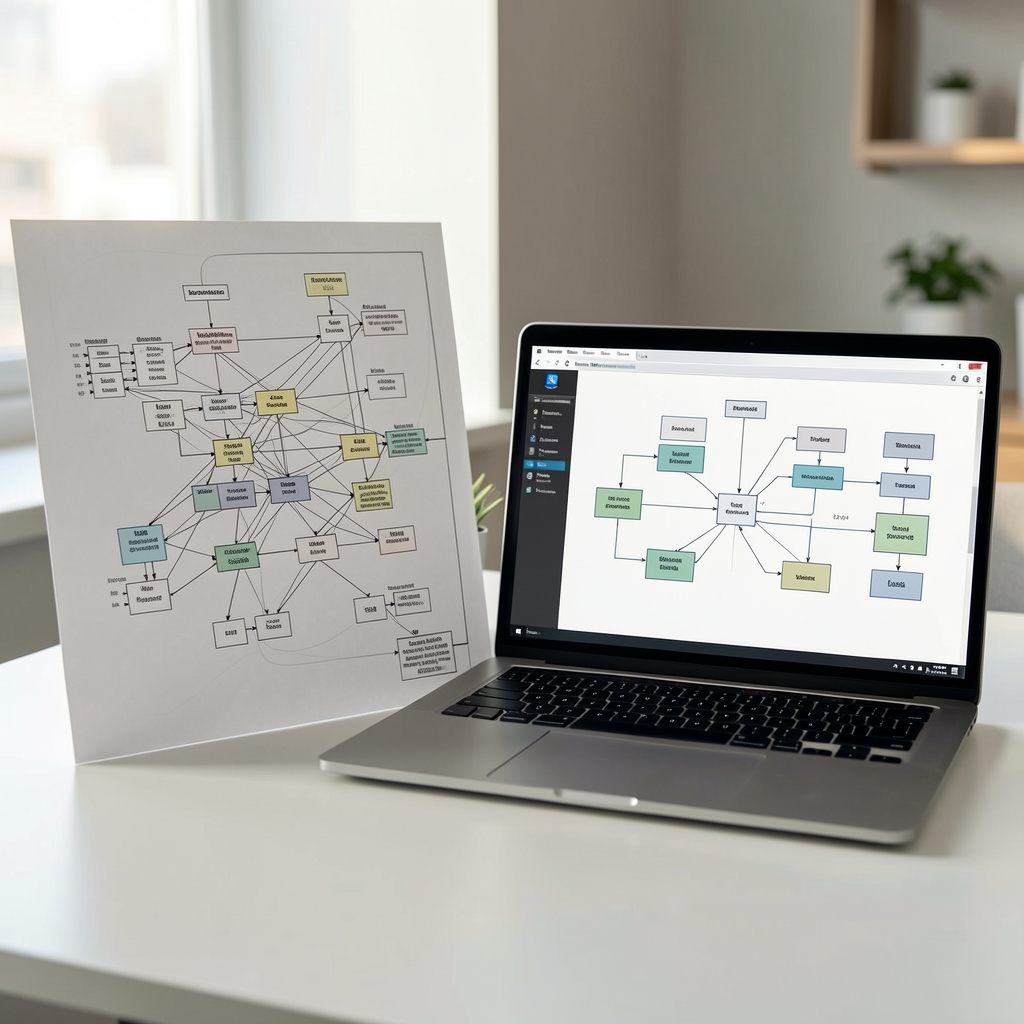
Systems desk · 2026

Integration frameworks that keep evidence connected

Good reporting joins monitoring, maintenance, energy data and governance records without pretending that one dashboard answers every question.

Integration is not simply the act of connecting software. It is the discipline of preserving meaning as information moves from a sensor, validator, operator log or governance record into a report. A timestamp without a timezone, an alert without a threshold and a performance number without a boundary can create a polished but misleading picture.

“A connected system is only as clear as the definitions that travel with its data.”
Three pillars of an evidence chain

Observe

Collect timestamps, machine identifiers, network status and environmental readings. Observation includes documenting gaps, delayed readings and unavailable sensors.

  • Identify the source and owner.
  • Record the unit and frequency.
  • Preserve the original timestamp.

Explain

Attach definitions, source notes and context to every important number. A reader should know whether a figure is raw, calculated, estimated or transcribed.

  • Define technical terms.
  • State transformations.
  • Link to versioned documentation.

Review

Make exceptions, outages and changes visible to the people reading the record. Review is an operating habit rather than a final presentation layer.

  • Flag anomalies.
  • Record who reviewed them.
  • Explain unresolved questions.

Mapping a connected record

LayerExample inputUseful contextCommon ambiguity
EquipmentMachine identifier and firmware versionInstallation date and maintenance stateWhether inactive units are included
FacilityPower draw and temperatureMeter boundary, season and cooling modeFacility load versus compute load
NetworkValidator status or block recordProtocol version and observation intervalReported uptime definition
GovernanceProposal, vote or parameter changeDecision date and activation dateWho had authority to decide

These layers should not be merged into one score without a clear reason. A low temperature reading may coincide with a maintenance shutdown, and an active validator may still be subject to a later governance change. Keeping source fields available allows a reader to revisit the interpretation.

A practical integration sequence

  1. Inventory. List systems, owners, identifiers, fields and expected update intervals.
  2. Normalize. Standardize units, timezones and naming without deleting the original value.
  3. Annotate. Add source links, definitions, maintenance notes and confidence boundaries.
  4. Compare. Test whether records refer to the same location, period and population.
  5. Publish. Show the result together with exceptions, assumptions and a route for correction.

For a small team, a carefully maintained spreadsheet can express these principles. For a larger operation, an event log, data catalogue and role-based review process may be appropriate. The technology should follow the evidence need, not the other way around.

Seeing the system in context

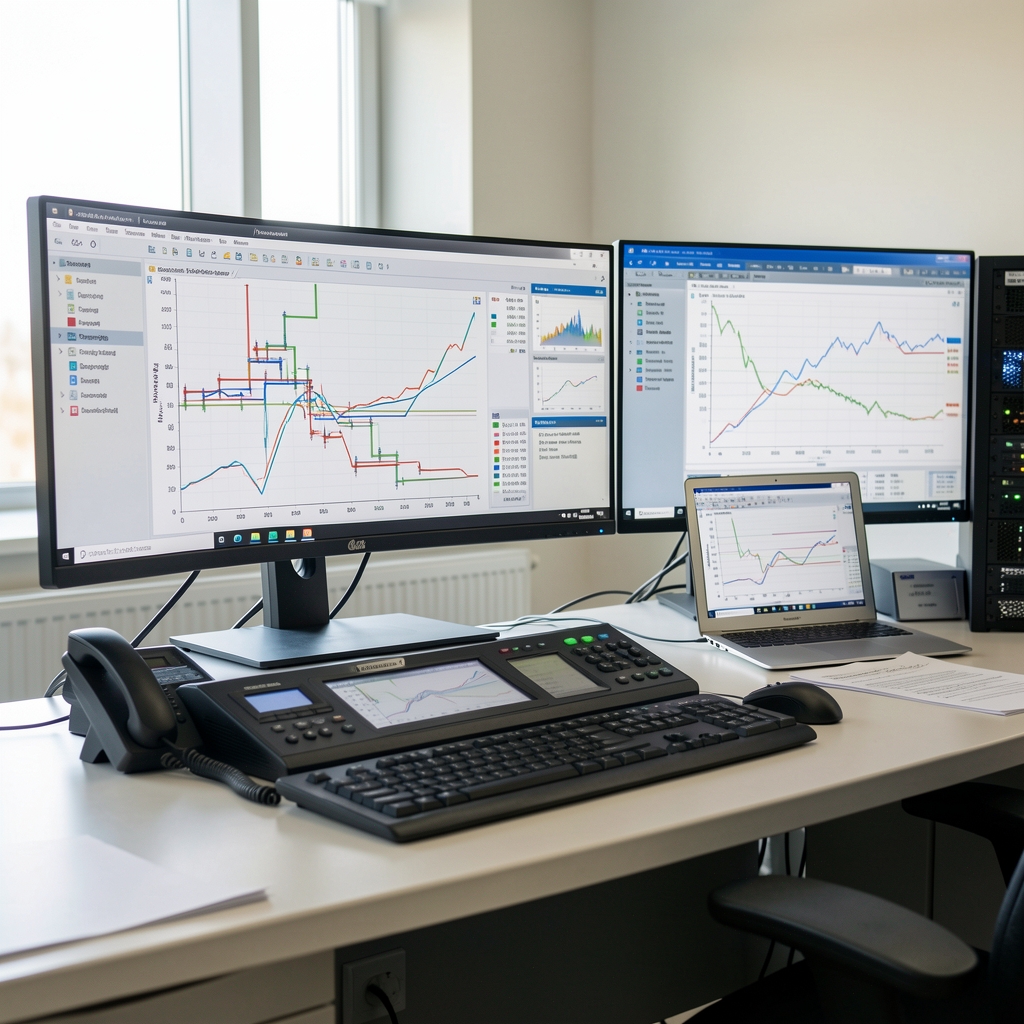
Multi-screen operations console showing infrastructure monitoring charts and maintenance notes

A console can help an operator see change, but it can also hide the assumptions behind a chart. Zafara therefore looks for a companion explanation: what is measured, how often, by which instrument and under which exclusion.

Readers should treat visual dashboards as a starting point for questions. They are not by themselves a substitute for source documents, operating procedures or a current review of applicable requirements.

Read the facilities desk
Printed technical network map beside a laptop displaying a systems integration diagram